
Distilling Complexity: A Visual Lifeline for Ethiopia’s Mobile Health Teams
CLIENT: Save the Children, Ethiopia Country Office
PROJECT TIME: March 2025
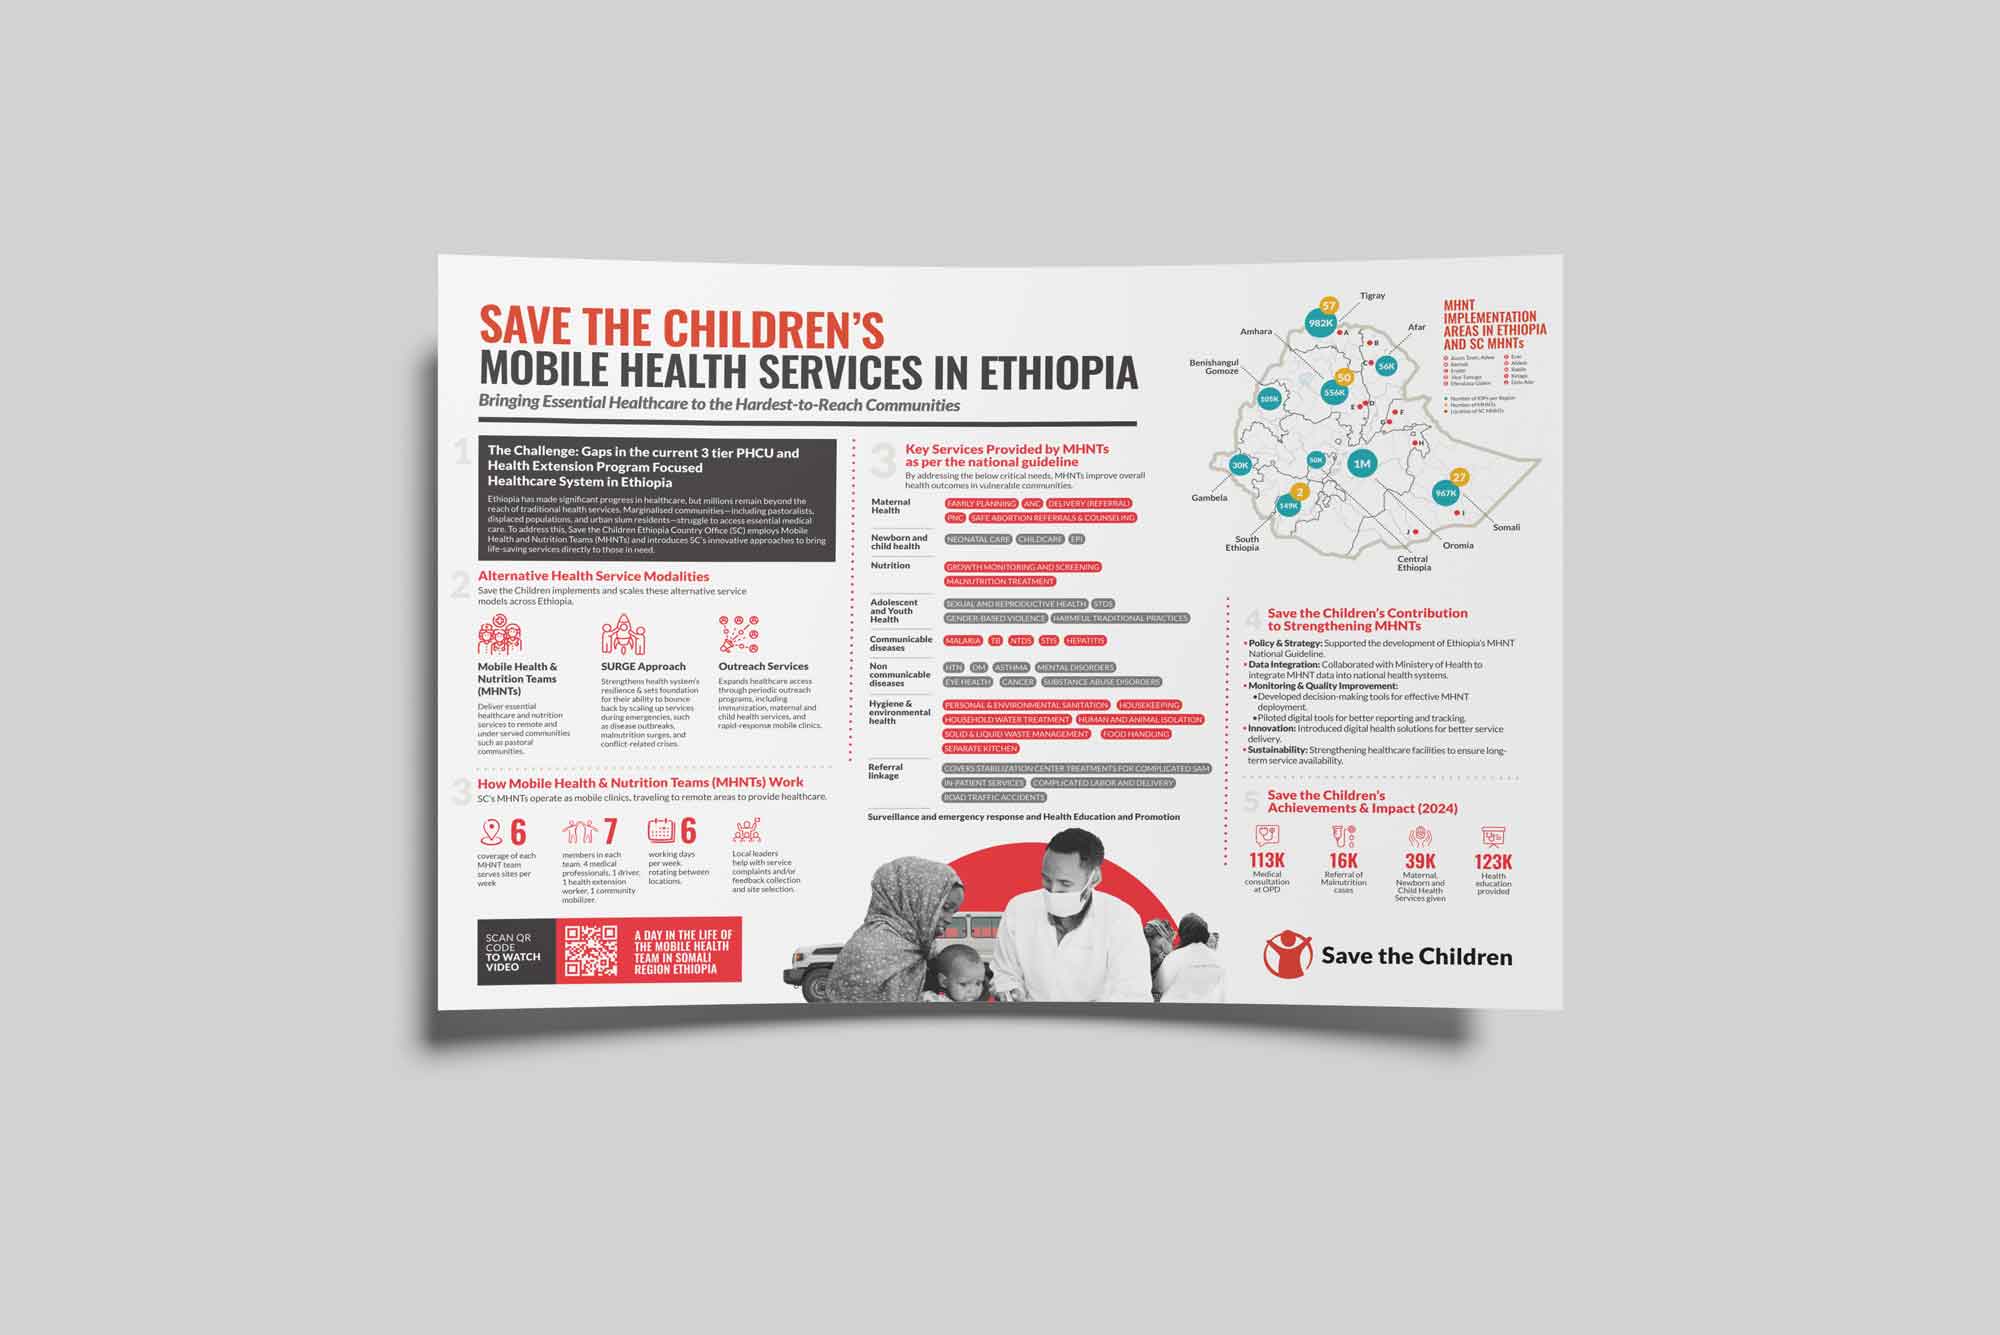
When the Bill & Melinda Gates Foundation delegation planned their visit to Ethiopia, Save the Children needed more than just a presentation; they needed a story. The challenge was to communicate the vast, life-saving operations of the Mobile Health and Nutrition Teams (MHNTs) in a single, powerful visual. The data was immense and complex—a sea of statistics, operational details, and geographical coordinates. My task was to transform this raw information into a clear, compelling infographic that would instantly convey the immense impact of these mobile clinics.
The Challenge: From Data Overload to Narrative Clarity
The initial information was a classic case of data overload. I was presented with extensive raw data on the MHNTs’ operations across Ethiopia. The sheer volume could be overwhelming, making it difficult to discern the core message. The goal was to distill this complexity into a narrative that was not only easy to understand but also emotionally resonant, highlighting the human impact behind the numbers. This required a strategic approach to data organization and visual storytelling.
The Process: A Methodical Approach to Meaningful Design
My process began with a deep dive into the data. I started by “cleaning” and structuring the information, gravitating towards the most impactful numbers that told the clearest story. This involved identifying key metrics—like the number of medical consultations and the reach of maternal and child health services—that would serve as the backbone of the infographic.
With a clearer data structure, I moved to the creative phase. I employed a “boxing” technique for the layout, starting with a simple, high-level structure to arrange the different sections of the infographic. This methodical approach allowed for flexibility and prevented the design from becoming cluttered. It enabled me to experiment with various arrangements, ensuring a logical flow from the overarching challenge to the tangible impact.
Once the foundational structure was set, I began to layer in the design elements. Drawing inspiration from contemporary infographic design, I focused on creating a visually engaging and accessible layout. This involved a carefully selected color palette that aligned with Save the Children’s branding while ensuring clarity, and the use of icons and a clear typographic hierarchy to guide the viewer’s eye through the narrative. The map of Ethiopia, with its data overlays of Internally Displaced Persons (IDPs) and MHNT locations, became the central visual anchor, immediately grounding the data in a real-world context.
The Outcome: A Powerful Tool for Advocacy and Engagement
The final infographic is a testament to the power of strategic design in the humanitarian sector. It successfully translates complex operational data into a clear and compelling visual narrative. The document effectively communicates the scope and scale of Save the Children’s MHNTs, showcasing not only the services provided but also the immense reach and impact on vulnerable communities.
This project was more than an exercise in data visualization; it was about creating a tool for advocacy. It provided the Gates Foundation delegation with a concise and powerful overview of the MHNTs’ critical work, demonstrating my ability to bridge the gap between complex field operations and high-level strategic communication. This piece exemplifies my commitment to creating designs that are not only aesthetically pleasing but also serve a strategic purpose in advancing humanitarian goals.
No Comments